Part B
48. Directions:
In this section, you are asked to write an essay based on the following chart. In your writing, you should
1) Interpret the chart and
2) Give your comments.
You should write at least 150 words.
Write your essay on on ANSWER SHEET 2. (15 points)
参考范文
Part B
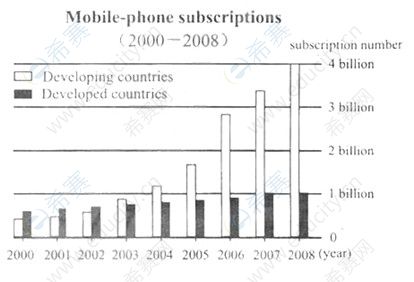
In this chart, we can see the mobile phone subscriptions in developed countries have a steady and slight increase from 1990 to 2007 and then remain constant in 2008. Meanwhile the mobile phone subscriptions in developing countries have witnessed a slow increase from 1990 to 2004 and then a great surge from 2004 to 20007: the biggest surge happens from 2005 to 2006.
This chart reflects different developing modes of mobile phone industry in developed and developing countries. The developed countries have a limited number of populations, most of whom are well-educated. Therefore, the spreading of the mobile phone service is efficient and soon the market is saturated. Also at the beginning the developed countries have more people who can afford this service. The developing countries have a large population who keeps a large demand for mobile service. As the mobile phone service becomes cheaper and cheaper, the increasing customers subscribe to benefit from this service.
As discussed above, it is not surprising to see this change. In my opinion, this trend that the number of mobile-phone subscriptions is increasingly increasing will continue for a while in the future.
温馨提示:因考试政策、内容不断变化与调整,本网站提供的以上信息仅供参考,如有异议,请考生以权威部门公布的内容为准!