3.2014年真题:社会热点类:经济
Write an essay based on the following chart. In your writing, You should
1) interpret the chart, and
2) give your comments.
You should write about 150 words on the ANSWER SHEET. (15points)
20年间中国城镇人口/乡村人口变化图(单位:百万)
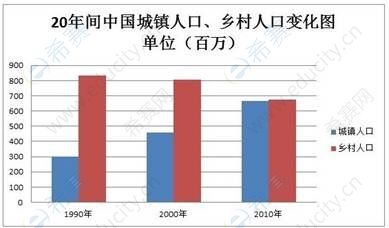
The column chart above clearly reflects the changes in the statistics of the urban and rural populations in China during the past two decades.For urban dwellers, there was a noticeable jump of 360 million—from 300 million to 660 million—between 1990 and 2010. By contrast, a remarkable decline occurred in the rural population—by 150 million, from 820 million to 670 million—during the same period.
At least three primary contributing factors account for these changes. First and foremost, there is a much nicer choice of options available in cities and towns, across the board.There are more jobs to choose from,different kinds of companies and types of work.In addition, big cities offer much more excitement and stimulation, partly as a result of all the various options available in so many areas.More importantly, people prefer to live in cities and towns for the convenience of the transportation system. They usually have a well developed bus,subway,highway and airport transportation networks.
Generally speaking, people in expanding numbers would prefer to live in cities and towns which offer a rich variety of many options, whether it is for jobs, leisure, culturalor intellectual activities. At the same time, people like the energy and stimulation of a big city environment and the convenience of a well-developed transportation system. (221 words)
温馨提示:因考试政策、内容不断变化与调整,本网站提供的以上信息仅供参考,如有异议,请考生以权威部门公布的内容为准!