一、单选题(共45题,共计90分)
1、We must find a way to cut prices _____________ reducing our profits too much.
A. without B. despite C. with D. for
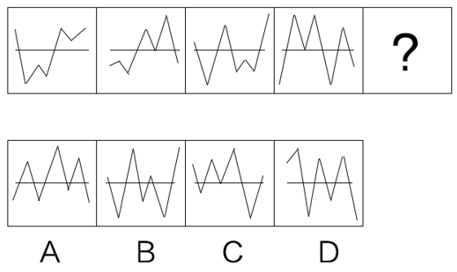
2、从所给四个选项中,选出最合适的一个填入问号处,使之呈现一定规律性:
二、多选题(共20题,共计40分)
1、以下属于五大洲的是()
A.亚洲 B.欧洲 C.非洲 D.澳洲
三、材料分析题(共7题,共计70分)
1、根据以下资料,回答1~5小题
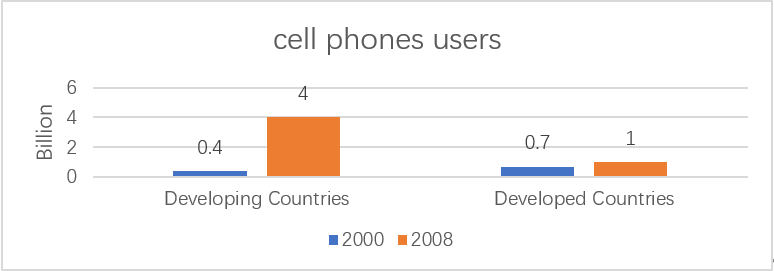
Developed(发达) and developing(发展中) countries saw different rates of growth in cell phone users from 2000 to 2008. As the bar graph(条形图) shows, the number of cell phone users in developed countries rose steadily (稳步增长)from 0.7 billion in 2000 to one billion in 2008. By contrast(相比之下), cell phone users in developing countries rose from 0.4 billion to 4 billion in the same period.
Why? The first reason is technology. Developed countries generally enjoy high technology, which can make them to use cell phone ahead of developing countries. Another reason is the difference in population size. As we know, developed countries usually have a small population but most developing countries a large. As the price of the cell phone falls, more and more people in developing countries will use this service, which explains high number of users in these countries since 2003.
From this case, we see that developing countries are quickly catching up(赶追) in science and technology, which will narrow (减少) the difference between the developing and developed countries.
(1) What is the number of cell phone users in developing countries in 2008?
A. 0.4 billion B. 0.7 billion C. 4 D. 1
(2) What is the second reason for the difference?
A. technology B. number of users C. population size D. users
(3) What is the difference between developed and developing countries for the number of users in 2000?
A. 0.3 billion B. 3.6 billion C. 0.3 billion D. 3 billion
(4) What is the difference for developing countries for the number of users from 2000 to 2008?
A. 0.3 billion B. 3.6 billion C. 0.3 billion D. 3 billion
(5) What is the passage mainly about?
A. the different growth rate for the number of cell phone users and its reasons
B. the growth rate for the developing countries
C. the steady growth of the cell phone users
D. the developing countries are quickly catching up
2、根据以下资料,回答6~10小题
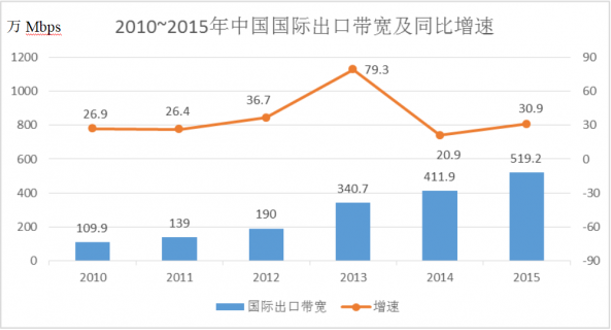
(6)2010~2015年间,中国国际出口宽带增速高于30%的年份有多少个?
A.1
B.2
C.3
D.4
(7)2009年,中国国际出口带宽最接近以下哪个数字?
A.71万MBps
B.87万MBps
C.97万MBps
D.128万MBps
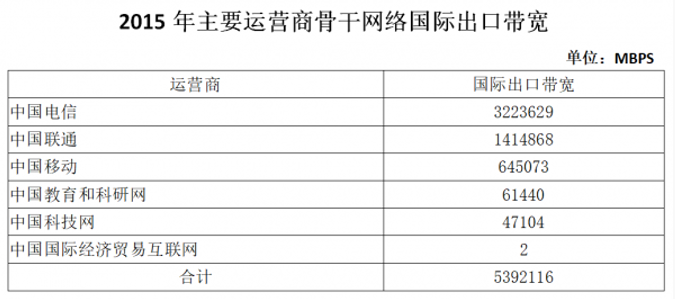
(8)以下各图,最能体现2015年中国移动提供的国际出口带宽(黑色部分)在主要运营商骨干网络国际出口带宽中所占比例的是:
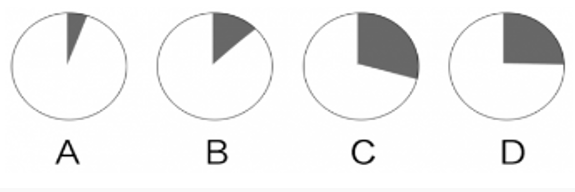
(9) 2010~2015年,中国国际出口带宽增速最高的年份,其增量比增速最低的年份的增量:
A.多71.2万MBps
B.少71.2万MBps
C.多79.5万MBps
D.少79.5万MBps
(10)能够从上述资料中推出的是:
A.2015年中国国际出口带宽比2010年增长了5倍
B.2010~2015年,中国国际出口带宽的增速逐年上升
C.2010~2015年间,中国国际出口带宽增量最高的两年相邻
D.“十二五”(2011~2015年)期间中国国际出口宽带年均增长80万MBps以上
热门文章推荐>>
2022年单招课程来袭,适合人群:基础差,面试经验匮乏考生,赶紧来看>>